Yesterday the Federal Reserve released the latest
Beige Book. Below are excerpts from the report along with relevant charts to further explain some of the points. All charts are from
Econoday unless otherwise noted.Here is the overall summary:
Reports from the twelve Federal Reserve Districts suggest that the pace of economic activity slowed somewhat since the last report. Five eastern Districts noted a weakening or softening in their overall economies, while Chicago characterized its economy as sluggish and Kansas City noted a moderation in growth. St. Louis said activity was stable and San Francisco reported little or no growth. Cleveland and Minneapolis reported slight increases in economic activity, while Dallas described growth as steady and moderate.
Consumer spending was reported as sluggish or slowing in nearly all Districts, although tax rebate checks boosted sales for some items. Tourist activity was mixed, with residents in several Districts choosing to vacation closer to home due to high gasoline prices. The demand for services was also mixed across Districts, with strength in the IT and health care industries offsetting some weakness in other service sectors. Manufacturing activity declined in many Districts, although demand for exports remained generally high. Residential real estate markets declined or were still weak across most of the country. Commercial real estate activity also slowed or remained sluggish in a majority of Districts, although a few Districts noted slight improvement. In banking, loan growth was generally reported to be restrained, with residential real estate lending and consumer lending showing more weakness than commercial lending. Districts reporting on agricultural activity said conditions were mixed, based largely on how June precipitation affected them. Districts reporting on the energy sector said it continued to strengthen.
All reporting Districts characterized overall price pressures as elevated or increasing. Input prices continued to rise, particularly for fuel, other petroleum-based materials, metals, food, and chemicals. Retail price inflation varied across the country, with some Districts reporting increases but others noting some stability, at least for the present. Wage pressures were generally limited in most Districts, as labor market demand was soft except for highly skilled workers and in the energy sector.
Let's take this piece by piece:
Consumer spending was reported as sluggish or slowing in nearly all Districts, although tax rebate checks boosted sales for some items
Retail sales were dropping on a year over year level since October of last year. However, they did experience a slight increase last month. My guess is the stimulus checks were part of the reason for that.
Personal consumption expenditures have been rising on a year over year basis since the beginning of the year. This figure includes retail sales but also has other expenditures such as services etc... included. The length of this increase is too long to be a statistical aberration. I have no explanation for it.
The demand for services was also mixed across Districts, with strength in the IT and health care industries offsetting some weakness in other service sectors
The ISM services index has been dropping for several years, indicating the overall trend is down. Also note a reading of 50 and below is considered a sign of contraction. The index has printed a reading below 50 in 4 of the last 6 months.
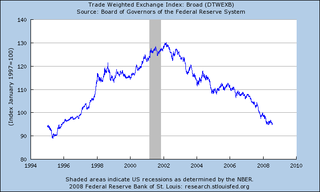
Manufacturing activity declined in many Districts, although demand for exports remained generally high.
Industrial production has been declining on a year over year basis since the end of last year.
As has capacity utilization -- the percentage of manufacturing resources in use.
The Philly Fed has printed some terrible numbers since the end of last year,
As has the empire state survey
The ISM manufacturing survey has increased over the last two months, but has printed a number below 50 5 of the last months indicating a contraction. My guess is the increase over the last few months indicates an increase in export orders caused by the low dollar.
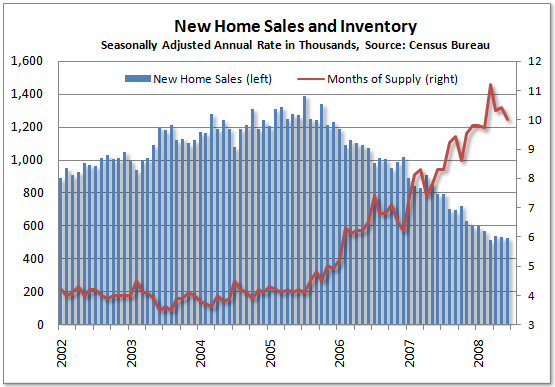
Residential real estate markets declined or were still weak across most of the country
Prices are still
falling off a cliff:Home prices across 20 major U.S. cities have dropped a record 15.3% in the past year and are now back to where they were in the summer of 2004, according to the Case-Shiller home price index released Tuesday by Standard & Poor's.
Prices in the 20 cities are now down 17.8% from the peak two years ago.
Prices were lower in April than they were a year earlier in all 20 of the major metropolitan areas as tracked by the Case-Shiller index.
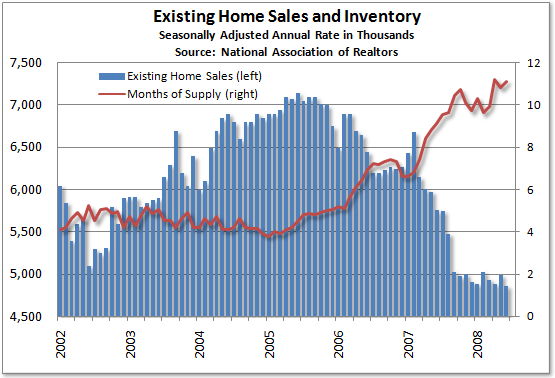
And today's existing home sales report
hows further weakness:Sales of existing single-family homes declined 3.2 percent to an annual rate of 4.27 million pace. Purchases of condos and coops increased 1.7 percent to a 590,000 pace.
The median sales price fell to $215,100 from $229,000 in June 2007. The median cost of a single-family home decreased 6.7 percent to $213,800, while that of condominiums and co-ops fell 2.2 percent to $224,200.
Purchases decreased in three of four regions, led by a 6.6 percent decline in the Northeast. Sales rose 1 percent in the West, which also showed a 17 percent drop in the median price, the biggest of any region.
The number of previously owned unsold homes on the market at the end of June rose to 4.49 million from 4.482 million in May. The total represented 11.1 months' supply at the current sales pace. The agents' group has said that a five-to-six month's supply reflects a balanced market.
The reason for this drop in sales is the tightening credit conditions mentioned above.
Sky high inventory levels + tightening credit = dropping prices.
I'm going to add two points.
Job growth is terrible:
and unemployment is rising:
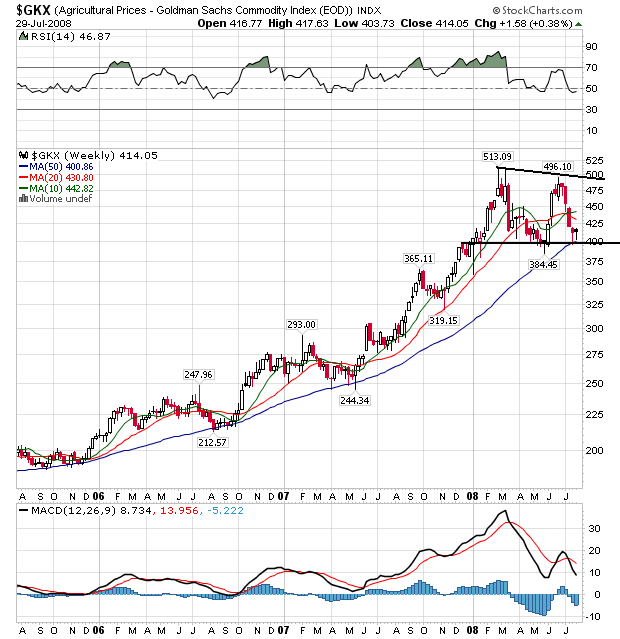
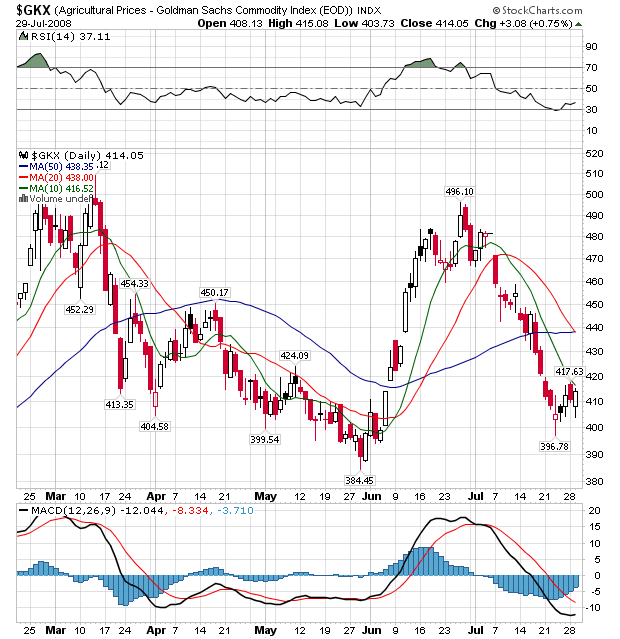
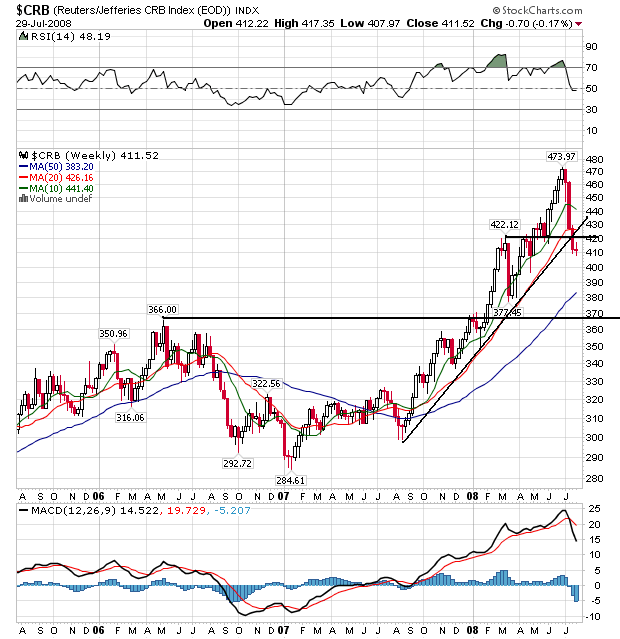
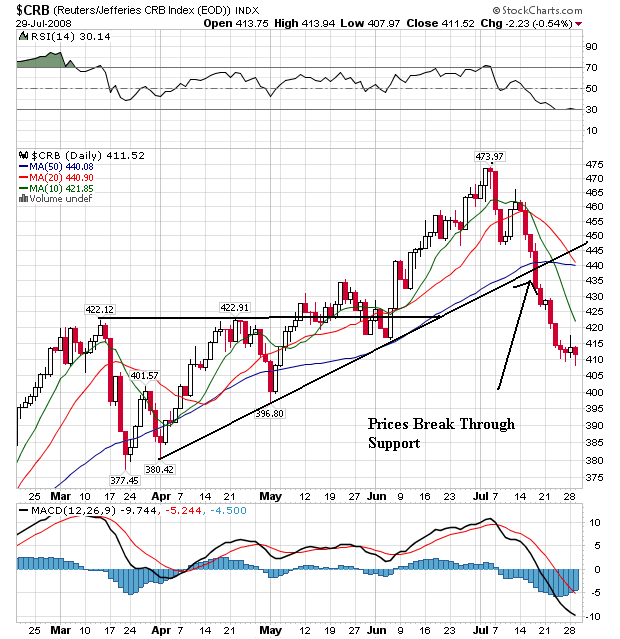
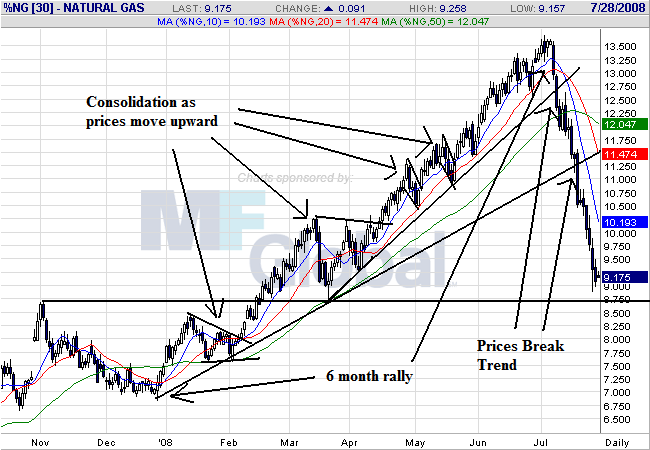
And then there are prices:
Import prices are increasing on a year over year basis, as are
Producer Prices.
Consumer prices are at high levels on a year over year basis.
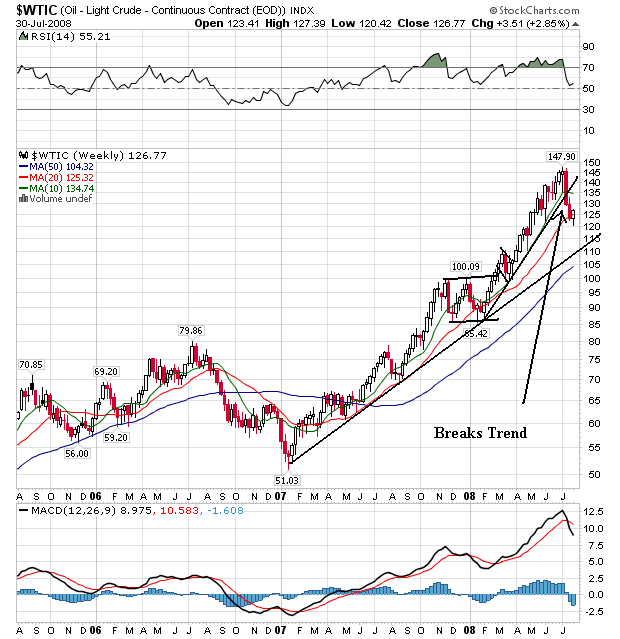
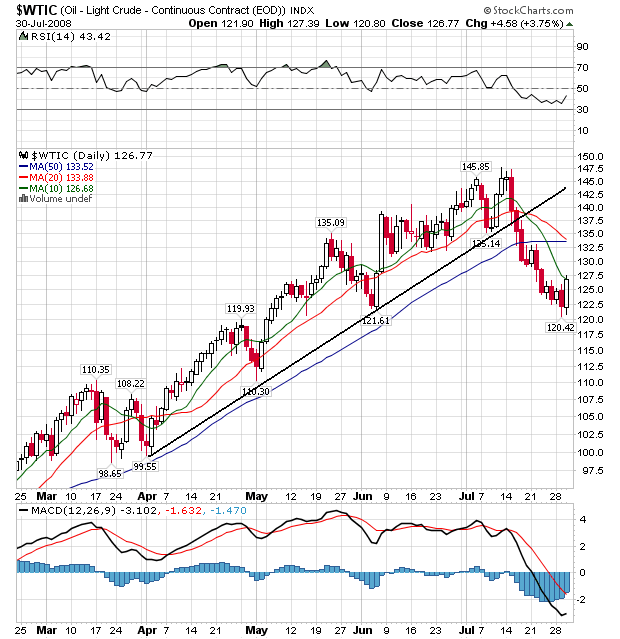
Now, recently there have been some drops in both the prices of agricultural goods and oil. If there continue we may see a decrease in inflationary pressures. But we're not there yet.
Let's review.
Consumers are slowing their shopping
The service sector is contracting.
The manufacturing sector is contracting.
Housing is still deteriorating.
Job growth is deteriorating, and
Prices are increasing.