Monday, March 31, 2008

Today's Markets


With the SPYs, notice the following:

-- The market was in an upward sloping channel until a bit after lunch.

-- The market broke the upward trend in the early afternoon.

-- The market tried to rally twice through the 200 SMA but was rebuffed.

-- There is upward resistance in the 132.50 - 132.60 range


Notice the following:

-- There are interlocking trends/patterns. There is a triangle pattern in the morning. There is also an upward sloping trend channel that the market broke a bit after lunch.

-- The market tried to rally through the 200 SMA three times but was rebuffed.


With the IWMS, notice there are two patterns.

-- An upwards sloping channel

-- A downward sloping pennant pattern.

Also note the IWMS only reached the 200 SMA once, crossed over and then retreated.

Are Commodities Heading Lower?

One of the main reasons I have been concerned about inflation is the incredible price spike across a variety of commodities. However, according to this week's Barron's cover story (subscription required) this may be the result of a speculative bubble. Here are some pertinent excerpts:

Here's the problem [with all of the bullish bets on commodities]: The speculators' bullishness may be way overdone, in the process lifting prices far above fair value. If the speculators were to follow the commercial players -- the farmers, the food processors, the energy producers and others who trade daily in the physical commodities -- they'd be heading for the exits. For right now, the commercial players are betting on price declines more heavily than ever before, says independent analyst Steve Briese.

For example, in the 17 commodities that make up the Continuous Commodity Index, net short positions by the commercials have been running more than 30% higher than their previous net-short record, in March 2004.

Briese, author of the recent book The Commitments of Traders Bible and editor of the Website CommitmentsOfTraders.org, was one of the first to recognize that information on the bets made by the commercials could provide rare insights into how the "smart money" views the price outlook. These days, the data suggest, the smart money clearly believes that the market's exuberance has turned irrational.

Indeed, the great commodities bubble started springing its first leaks two weeks ago: Oil, gold and other major commodities posted their steepest weekly drop in half a century. Though prices have since firmed, they could eventually drop 30% as speculators retreat. The only real question is when.

.....

Commodities index funds, which arrived on the scene in the late 1990s, have come into their own in the past several years. The biggest index fund, Pimco Real Return (ticker: PRTNX), has seen its assets swell to $14.3 billion from $8 million since its inception in January 1997.

Index funds offer investors an easy, inexpensive way to gain exposure to a segment of the commodities markets or a broad-based basket of commodities. Result: The funds have drawn many private investors who have never ventured into futures, along with pension funds and other institutional players looking to diversify. But for all the virtues that the funds hold as a way of spreading bets across commodity markets, they take only long, or bullish, positions, avoiding short-selling. In other words, they trade on the naïve and potentially fatal assumption that commodities have the same tendency as stocks to rise over the long run.


The short version of all this is that a technical abnormality relating to large investment funds is seriously distorting the true picture of commodities prices. Whether this is true or not I have no idea. I've never bee a big fan of economic models in general and am generally more suspicious of models that say "X% of this price goes to Y variable."

That being said. there is a strong possibility that the loophole in the futures market's rules is allowing a price distortion to occur that is not based on simple supply and demand of particular commodity.

According to the article, there will be a big meeting on April 22 to see how this plays out. Keep your eyes on that meeting.

What Inflation?

From Bloomberg:

European inflation accelerated to the fastest in almost 16 years in March, heightening the European Central Bank's quandary at a time when the economy is cooling and confidence is falling.

Consumer-price inflation in the euro area accelerated to 3.5 percent this month, the highest rate since June 1992, the European Union's statistics office in Luxembourg said today. That is faster than the 3.3 percent median forecast of 36 economists in a Bloomberg News survey. A separate report showed consumer and business confidence fell more than economists expected.

Rising food and energy prices are stoking inflation in the euro area, eroding consumers' purchasing power and pushing up costs at companies. ECB council member Erkki Liikanen said today that inflation expectations have ``hardened'' and the growth outlook has ``become more subdued,'' summing up the dilemma for the central bank, which is resisting cutting interest rates as inflation accelerates.


From Marketwatch:

Investors in interest rate-sensitive sectors such as automobile, financial services and real-estate firms are unlikely to breathe easy this week as India's inflation threatens to run out of control, dashing earlier hopes that the monetary policy could be eased some time this year to lift slowing economic growth.

In five quick weekly steps, the country's inflation shot up to a 15-month high of 6.68% in the week ended March 15, way above expectations of less than 6%, from 4.35% in the week ended Feb. 9. The more than two-percentage point inflation shock in such a short time has jolted policy makers just as it has economists, increasing chances of both fiscal and monetary action to prevent the situation from getting out of control.

And the government seems to be moving quickly. On Friday, trade minister Kamal Nath reportedly said the government was mulling an exports ban on some types of rice, while other government officials suggested a ban on edible oil exports, along with a reduction in import duties of other commodities.


It's important to remember the inflation picture is premised on spiking commodity prices. However, that picture may be changing.


The last rate cut by the Federal Reserve indicated that inflation was "elevated". In addition, the Fed cut 75 basis points rather than a full 100 basis points. This led some traders the the conclusion the Fed was near the end of its rate cuts. Whether this plays out is anyone's guess. But, the above chart indicates traders may be changing their thinking about the commodities market. Notice the following:

-- The index dropped about 7% the week of the Fed's rate cut.

-- Prices moved through the 10 and 20 day SMA

-- Both the 10 and 20 day SMA are now headed lower.

-- However, prices bounced off of the area where the 50 day SMA is currently located.

A lot depends on what happens with the dollar.


Notice the following.

-- There is still a bearish orientation to the chart.

-- All the SMAs are still headed lower

-- The shorter SMAs are below the longer SMAs

-- Prices are below the SMAs

-- However, prices may be forming a double bottom.

Short version -- the commodity price picture may be stabilizing for now.

Sunday, March 30, 2008

An In-Depth Look At the SPYs

I'm going to spend this week taking an in-depth look at the three major indexes. Let's start with the SPYs


This is a fifteen year chart in weekly increments. Notice the following.

-- We're clearly in the middle of a multi-year double top. The first top occurred in 2000 and the second top occurred in 2007.

-- Notice that prices are at roughly at the 38.2% Fibonacci retracement level for the rally that started in late 2002/early 2003.


Above is an in-depth look at the Fibonacci levels from the previous examples. Also notice the double top that occurred in this rally with the two tops occurring in the second half of 2007


On the above 6 year chart, notice the following.

-- The rally that started in mid-2003/early 2004 had two channel lines.

-- The market has broken through both channel lines.

-- The market is currently at an early 2006 price level.


On the six month chart notice the following:

-- Prices were in a clear down, up, down pattern.

-- Notice that prices have formed two bear market flags since the first of the year.


On the SMA chart, notice the following:

-- the 20, 50, and 200 day SMA are all moving lower

-- Prices and the 10, 20 and 50 day SMA are pretty bunched up right now. All are within 3 points of each other.

Conclusion: There is a great deal of support in the 126/127 area. The market has hit those levels twice and bounced back. Because of the two bottoms in that area the market could be forming a double bottom. But that has to be considered against the economic/fundamental backdrop. While the market can be a leading indicator, I don't think we've had enough pain for the market to be rebounding in anticipation of a recovery just yet.

Friday, March 28, 2008

Weekend Weimar and Beagle

It's that time of the week again. The markets are closed. That means it's time to think about anything except the markets. I'll be back bright and early Monday morning.


Personal Spending Flat

From marketwatch:

U.S. consumer spending was flat in February after adjusting for inflation, the third consecutive month of weak consumer demand, the Commerce Department reported Friday.

Real consumer spending has risen less than 0.1% seasonally adjusted since November, a clear sign that the main engine of U.S. economic growth is stalling as job growth wanes and house prices tumble.

Real consumer spending is on track to rise 0.8% annualized for the first quarter, economists said. "The plunging confidence numbers clearly point to an outright decline in the second quarter," wrote Ian Shepherdson, chief U.S. economist for High Frequency Economics.


Let's look at some pertinent charts


The real year over year change in disposable income has been dropping for a while now and is now lower at pretty dangerous levels.


Year over year change in consumption expenditures are also dropping.


Consumer confidence and sentiment are dropping as well.

For an economy the depends on consumer spending, these are not good developments.

Are More Banking Problems Coming?

From CNBC:

"I would say that while to date the problem banks have been quite low, there clearly has been some deterioration since the beginning of this year, and should the economy continue to slow down, as many expect, it is likely that we will continue to see some growth in the problem institutions," he told a seminar at the Bank of Korea.

.....

Rosengren said the turbulence was difficult to foresee because bank models focused solely on their exposure to riskier assets like subprime mortgages, ignoring the possible knock-on effects on other sectors.

"What these stress tests crucially failed to capture was the effect of house price declines on the large holdings of highly rated securities that global banks held -- the products of mortgage securitization activities, with their payment streams ultimately tied to the performance of subprime loans," he said.

The belief that housing prices would never fall on a national basis, which permeated even the Fed itself, was partly to blame for this underestimation of risk, Rosengren said.


So -- the models that measure stress aren't as attuned to this chart of the national Case Shiller Price Index:


as they should be. That's comforting.

Seriously, banks are nowhere near catastrophic levels of problems. So please do not read into this the fact that bank failures are occurring with regularity because they aren't. However, given the current situation it's clear the situation will get worse before it gets better.

And the FDIC is clearly thinking failures will increase: (hat tip to Calculated Risk

Federal bank regulators plan to increase staffing 60 percent in coming months to handle an anticipated surge in troubled financial institutions.

The Federal Deposit Insurance Corp. wants to add 140 workers to bring staff levels to 360 workers in the division that handles bank failures, John Bovenzi, the agency's chief operating officer, said Tuesday.

"We want to make sure that we're prepared," Bovenzi said, adding that most of the hires will be temporary and based in Dallas.

There have been five bank failures since February 2007 following an uneventful more than two-year stretch. The last time the agency was hit hard with failures was during the 1990-1991 recession, when 502 banks failed in three years.

The FDIC provides insurance for deposits up to $100,000. While depositors typically have quick access to their bank accounts on the next business day after a bank closure, winding down a failed bank's operations can take years to finish. That process can include selling off real estate, investments and dealing with lawsuits.

There are 76 banks on the FDIC's "problem institutions" list — which would equate to about 10 expected bank failures this year, though FDIC officials declined to make projections. Historically, about six banks fail per year on average, FDIC officials said.

Since 1981, total failures per year averaged about 13 percent of the number of institutions that started the year on the agency's list of banks with weak financial conditions.

There have been two failures in 2008 — both of which were small Missouri-based banks. By far the largest recent failure was the September 2007 shutdown of Georgia-based NetBank Inc., an online bank with $2.5 billion in assets. NetBank's insured deposits — representing more than 100,000 customers — were assumed by ING Bank, part of Dutch financial giant ING Groep NV.


And consider the following charts from the FDIC's latest Quarterly Banking Survey


Clearly the situation is deteriorating.

Is the Fed Rethinking Its Policy Toward Asset Bubbles?

From Bloomberg:

Federal Reserve officials may be rethinking their aversion to acting against asset-price bubbles, an article of faith during former Chairman Alan Greenspan's 18 years at the helm.

After this month's near-collapse of Bear Stearns Cos., Minneapolis Fed Bank President Gary Stern -- the longest-serving policy maker -- said in a speech yesterday that it's possible ``to build support'' for practices ``designed to prevent excesses.'' New York Fed President Timothy Geithner, whose district bank took on almost $30 billion of Bear Stearns assets to rescue the firm, argued two years ago for a larger role for asset prices in decision-making, and there's no indication his views have changed.

For Fed policy makers, ``the consequences of their permissiveness have become so disastrous that they simply can't keep singing the same old tune in public,'' said Tom Schlesinger, executive director at the Financial Markets Center in Howardsville, Virginia.

While the soul-searching is unlikely to result in immediate changes to monetary policy, Stern's comments show how the credit freeze has forced officials to scrutinize long-held philosophies about the Fed's role in markets, and even ask how their current policies may undercut those views.

``As a risk manager, the Fed needs to take account of both directions, not just dealing with the aftermath,'' said Bruce Kasman, chief economist at JPMorgan Chase & Co. in New York. ``We have had two asset-prices bubbles in the last 10 years that have had big implications for the Fed's desire for a more stable macroeconomy.''


While it is easy to criticize the Fed for its lax policies (God knows I have done it many times), the reality is the situation is far more complicated. When the economy is slowing (as it is now) lowering rate is the primary method the Fed has to soften the landing. However, how low is too low? At what point do low rates which are supposed to stimulate economic growth become excessively low, encouraging reckless behavior? And how soon after the economy comes out of a recession should the Fed raise rates? This is a difficult balancing act.

However, I am pleased to see a tacit understanding from the Fed that their policies have in fact been a reason for today's problems. Something I am sick and tired of hearing is the "we had no idea this would happen" defense -- especially from a bunch of economists who are well aware of basic supply and demand. When Greenspan tells everyone that he had no idea the reckless lending would happen it takes all of my resolve not to throw large objects at the television screen.

Thursday, March 27, 2008

Today's Markets


Yesterday the market's broke through an uptrend that started on Monday, March 17. Yesterday the markets traded in a range from 133.5 to 134.5. Today the market consolidated lower in a triangle pattern. Also note the market sold-off hard at the end. End of the day sales are never a good thing. It means traders are taking money off the table at the end of the day, or they are nervous that a bad overnight event could hit the markets.


The markets broke through upward resistance on Monday and peaked on Tuesday. Since then they've been trading in a downward sloping channel. Also note the QQQQs had a late day sell-off.


The IWMs broke their trend yesterday. Since then they have moved slightly lower, but it wasn't until the close today that they really fell hard. Again, traders are nervous about something happening overnight.

Has the Fed Removed Downside Risk?

I've been thinking about this portion of the latest Fed statement:

First, the Federal Reserve Board voted unanimously to authorize the Federal Reserve Bank of New York to create a lending facility to improve the ability of primary dealers to provide financing to participants in securitization markets. This facility will be available for business on Monday, March 17. It will be in place for at least six months and may be extended as conditions warrant. Credit extended to primary dealers under this facility may be collateralized by a broad range of investment-grade debt securities. The interest rate charged on such credit will be the same as the primary credit rate, or discount rate, at the Federal Reserve Bank of New York.


Let's take this one part at a time.

1.) There are two inter-related problems in the financing market right now. I call it C&C risk -- collateral and counter-party risk. Collateral risk is caused by all the junk paper out there (which everybody and their brother seems to own). This has led to the counter-party risk, where every lender is concerned that every borrower will default on even a short-term loan. Therefore, we're seeing a ton of cash hording right now.

2.) The Fed's action helps to alleviate that problem by doing three things. First, it opens the lending window to a wider audience. Now investment banks can borrow from the Federal Reserve. Secondly, it broadens the collateral the Fed sill accept. Essentially, borrowers can use a lot of the crappy paper out there (so long as it is investment grade or better) as collateral. Third, lowers the interest rate charged.

3.) What was the primary fear before the Fed's action? Default. What are the possibilities of a default in the current environment? Much lower. Why? Because if an institution gets in trouble it can use the paper that is probably causing at least part of the trouble to get a short-term loan from the Fed.

Does this prevent all problems? No. But it does alleviate the biggest fear out there right now -- a bankruptcy of a major Wall Street firm.

It's a Very Difficult Market to Read

Sometimes the charts are incredibly clear and give very clear signals. Sometimes they're about as clear as mud. The current market is definitely a case of the latter. Consider the following:


Above is the chart using simple moving averages. These SMAs give equal weight to all the numbers in the calculation, assuming that every number is equally important. Notice the following:

-- The long term SMAs (the 50 and 200) have continually moved lower, indicating the market's overall trend is down.

-- In February, the 10 day SMA was level and it intertwined with the 20 day SMA, giving hope to the bulls that a possible rally was underway.

-- Notice there is a great deal of buying support at the 126/127 level, indicating traders think this is fair value. We'll have to get through another earnings quarter before this changes.


Above is a chart with exponential moving averages, which give more weight to later/more recent numbers. This calculation assumes that what happened yesterday is more important than what happened a week ago. Notice the following subtle differences with the SMA chart:

-- The SMAs maintained a very bearish orientation of the lower averages below the longer averages for a longer time.

-- The 10 day EMA only crossed the 20 EMA for a brief time in February as opposed to intertwining with it.

Now consider the following line chart:


Line charts can be helpful because they clear out excess noise and help to show the underlying trend. With the above chart, notice we clearly formed a consolidating triangle from the beginning of the year to the end of February. But what about now? The markets are less clear.


And finally, we return to the candle chart. Notice the following:

-- We have a pretty clear triangle pattern.

-- Do be have a double bottom where the arrows are pointing? Technically we may. The question is does the fundamental information back-up this conclusion? I think the answer to that question lies with the Fed's action last week and the market's belief that it is enough to prevent a financial meltdown or recession.

A Quick Oil Update

Oil is rallying again.


Notice the following:

-- Prices retreated roughly 8% after the last Fed rate cut.

-- Prices retreated to the previously established support around 100

-- This price is also very close to the 38% Fibonacci retracement level for the early February/mid-March rally.

-- Yesterday the price moved through the 10 and 20 day SMA

-- The shorter SMAs are still above the longer SMAs

-- The 20 and 50 day SMA are still moving higher

Also, consider the following:

rude oil rose to its highest in more than a week after a pipeline explosion in southern Iraq, threatening to reduce exports.

The pipeline was on fire and the disruption will likely cut shipments to the Basra export terminal, an Iraqi official said. Iraq, holder of the world's third-largest crude reserves, ships most of the 2.32 million barrels it pumps each day from Basra.

``A setback like this and the militia activity in the last two days makes hopes for long-term peace and supply look fragile,'' said Robert Laughlin, a senior broker at MF Global Ltd. in London. ``We'd only just got used to Iraq supply becoming more reliable.''

Wednesday, March 26, 2008

Today's Markets


The SPYs are currently in a consolidation pattern. Note that today they broke through the trend line established a week ago Monday. But the average has been trading in the 133 - 135 range for the last three days. While there could still be a double top formation on Monday and Tuesday of this week, there is usually a stronger, sharper sell-off from that formation.


Like the SPYs, the QQQQs are essentially in a trading range between 44.40 and 45. This shouldn't be surprising considering the QQQQs were in a range for about 7 days on the chart. Also note there is still an uptrend in place that started last Monday.


Much of the QQQQ analysis applies to the IWMs. However:

-- The average is trading between 69.25 and 70.25

-- The average is bumping up to its trend line.

Commodities/Dollar Update

One of the big stories for the last 3-6 months is the commodities boom. Just to refresh your memory, the commodity market has been on fire for two inter-related reasons. As the Fed started to cut interest rates it became clear to traders that the Fed was going to let inflation run. As a result, traders bid up commodities as an inflation hedge. In addition, as the Fed cut interest rates the dollar became less attractive as a place to park money, so the dollar continued to fall. Because most commodities are priced in dollars a drop in the dollar is a de facto price gain in anything priced in dollars. So, the commodity and dollar markets were involved in a fairly vicious circle.

The Fed's last rate cut announcement led to speculation the rate cuts were nearing an end. This led to a rally in the dollar and sharp drop in commodity prices last week.

Let's see where the charts stand now:


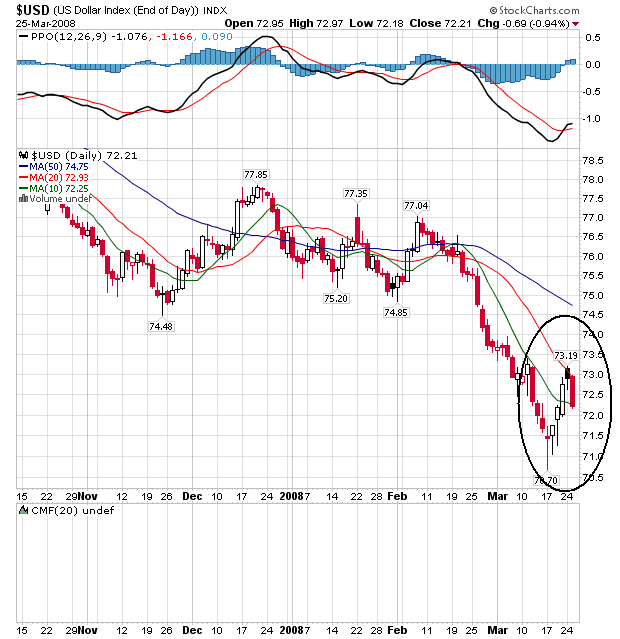
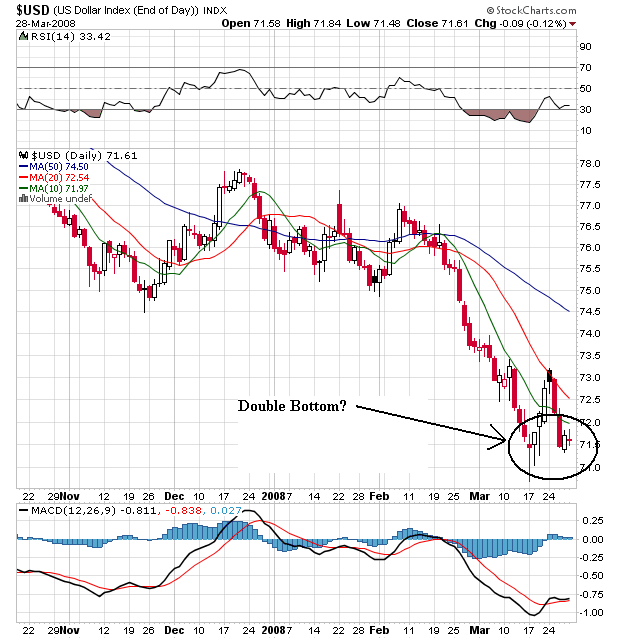
On the dollar chart, notice the following:

-- The dollar rallied to its 20 day SMA and then fell back.

-- The dollar is currently trading at the 10 day SMA.

-- All the SMAs are moving lower

-- The shorter SMAs are below the longer SMAs

The next few days are exceedingly important for the dollar.


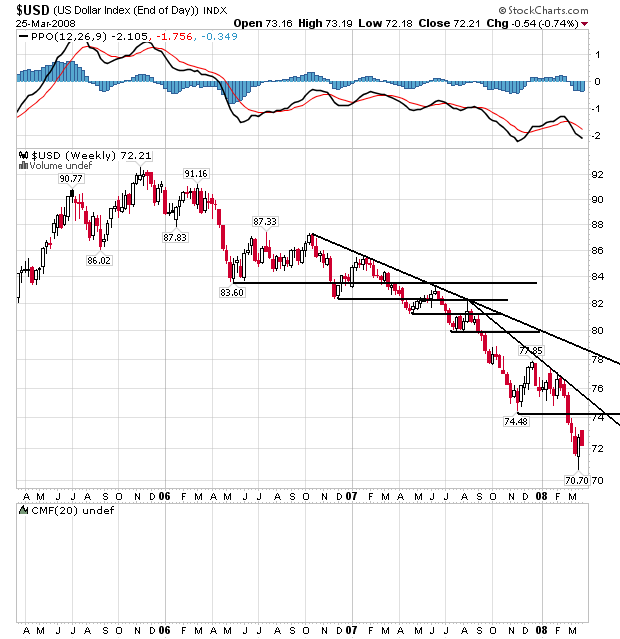
On the monthly chart, notice:

-- The dollar is in a clear, multi-year downtrend. It is in a pattern of lower lows and lower highs.

-- The chart has continually broken through technical support.

-- There are several strong downward sloping trends in place.


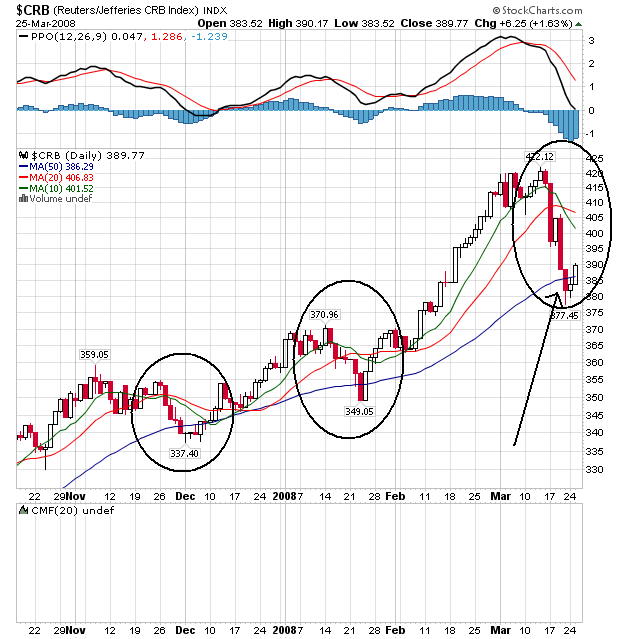
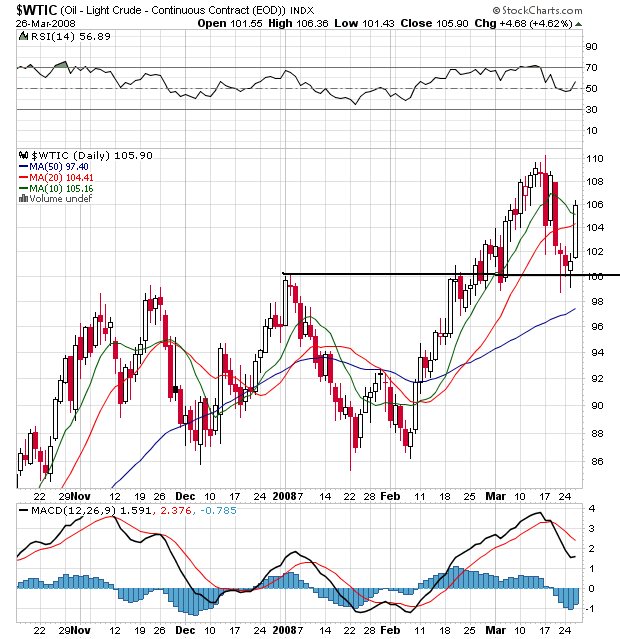
On the commodities chart, notice the following:

-- Two other times in the last 6 months prices have dropped to the 50 day SMA over the period of about a week to a week and a half. Both times prices rallied back.

-- However, the last two times this happened, the SMAs were closer together. Over the last month the 10 and 20 SMA have moved pretty far above the 50 day SMA. In other words, the SMAs might need time to catch-up with price action.

-- Note the 10 day SMA has crossed below the 20 day SMA. This is a bearish crossove and may indicate we have lower prices ahead.

-- So far, prices have repeated what has happened twice before.


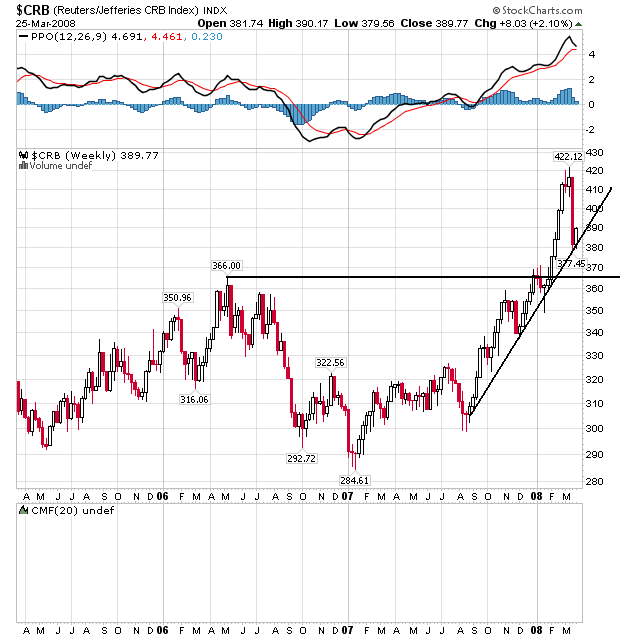
On the monthly CRB chart, notice the following:

-- Prices are currently at the uptrend.

-- There is support at 366 -- about 6% below current price levels.

Are We In For Long-Term Stagnation in Stock Prices?

From today's WSJ:

The stock market is trading right where it was nine years ago. Stocks, long touted as the best investment for the long term, have been one of the worst investments over the nine-year period, trounced even by lowly Treasury bonds.

The Standard & Poor's 500-stock index, the basis for about half of the $1 trillion invested in U.S. index funds, finished at 1352.99 on Tuesday, below the 1362.80 it hit in April 1999. When dividends and inflation are factored into returns, the S&P 500 has risen an average of just 1.3% a year over the past 10 years, well below the historical norm, according to Morningstar Inc. For the past nine years, it has fallen 0.37% a year, and for the past eight, it is off 1.4% a year. In light of the current wobbly market, some economists and market analysts worry that the era of disappointing returns may not be over.

Until last fall, many investors had viewed the bursting of the tech-stock bubble as a nasty but short-term setback. The market had resumed its upward march, reaching new highs in October. Then the credit crisis began weighing on stocks, as did the possibility of a recession. By March 10, the S&P 500 was down 18.6% from its Oct. 9 record close, nearing the 20% decline that signals a bear market. It has rebounded since then amid the Federal Reserve's efforts to stabilize the financial system, but it remains 13.3% below its October record.

Conventional stock-market wisdom holds that if investors buy a broad range of stocks and hold them, they will do better than they would in other investments. But that rule hasn't held up for stocks bought in the late 1990s or 2000.

Over the past nine years, the S&P 500 is the worst-performing of nine different investment vehicles tracked by Morningstar, including commodities, real-estate investment trusts, gold and foreign stocks. Big U.S. stocks were outrun even by Treasury bonds, which historically perform much less well than stocks. Adjusted for inflation, Treasurys are up 4.7% a year over the past nine years, and up 5.8% a year since the March 2000 stock peak. An index of commodities has shown about twice the annual gains of bonds, as have real-estate investment trusts.


This is a really good observation and it raises many troubling questions for the next 5-10 years.

While no one has a crystal ball that sees perfectly (or imperfectly for that matter) there is no denying that current economic conditions are terrible. Our current problems started with a massive real estate glut. Supply and demand are still massively out of whack (see this article) and will be for some time. Anyone who is calling a bottom in housing that occurs before the 4th quarter of this year is engaging in spin rather than analysis.

The real estate problems have infested the US financial system. Simply put, everyone jumped on the real estate bandwagon with the end result being that now everyone is hurting. And there is no reason to think this won't continue for some time. Economic problems are at the heart of the financial systems problems as more and more homeowners stop paying their mortgages or simply walk away because their home's price is now horribly below the total value of the mortgage.

And this is before we get to to heavily indebted consumer who is literally drowning in debt payments. The national government isn't doing much better and state governments are quickly making up for lost time.

There are two charts the bolster the WSJ's points. Here is a 15 year chart of the SPYs. Notice we are clearly on the downside of a possible double top formation with the first top occurring in 2000 and the second occurring in 2007:


The second chart is the reset chart for the mortgage industry. Notice that we have a second wave of resets that starts in 2010! This means we could experience the exact same situation today that we're experiencing now.


I want to caution -- no one has a crystal ball and the above analysis is largely an extrapolation of current events to the future. But it's also important to remember the long-term chart formation of the SPYs is not good and the underlying fundamental economic backdrop is poor right now with very little positive news filtering through. In short -- things ain't that good right now.

Tuesday, March 25, 2008

Yesterday's Markets

Here's an interesting question for Bonddad readers: Is it better to have the market wrap after the market closes or in the morning before the market opens?

Anyway -- let's look at the long-term charts


The SPYs have the most interesting 10-day chart. On the left, notice we have two triangle consolidations. The first is more level and the second is a downward sloping wedge triangle. We get a gap up on the opening of "Fed day". This was followed by a further spike up after which the market dropped hard for the rest of the day. Starting on Thursday of last week we had a rally. But if you look carefully at the SPYs (and where I added an arrow) you'll see the possibility of a double top.


On the QQQQs we have a clear trading pattern followed by a break-out in an upward sloping wedge.


On the IWMs, notice we have another trading pattern followed by a break-out. But there is the possibility of a double top with this chart.

Today's Markets, er, Tomorrow

I've got a doctor's appointment that I have to run to (I'm fine. This is routine stuff). But I'm leaving before the market closes. I'll run "today's markets" tomorrow morning.

Case Shiller Index Drops Record Amount

From the AP

Home prices in many cities continued to plunge by record levels in January as sellers cut their asking bids and rising foreclosures took their toll, new data showed Tuesday.

While the spring selling season usually gives the market a bounce, some analysts say any notable improvement may not come until well into the summer. U.S. home prices fell 10.7 percent in January, and the Standard & Poor's/Case-Shiller home price index of 20 cities saw the steepest decline in the index's two-decade history.


Here's a chart of the price gains/losses for the index in the big cities:


Let's take a look at the chart for the US:


Notice the following:

-- During the 1990s the national price level really didn't move that significantly. Now, the stock market was our preferred bubble at the time so that might have taken some of the speculative excess out of the real estate market.

-- Notice the huge price increase during this expansion. Compare that increase to the increase during the last expansion. In comparison it looks like the latest price increase is unhealthy.

-- Notice we're just turning the corner on the downward move.

In other words, we have a long way to go.

Housing Nowhere Near a Bottom

From today's WSJ:


A glut of foreclosed homes of historic proportions is starting to drive down U.S. home prices faster as lenders put more properties on the market and buyers show signs of interest.


The ability of America's lenders to manage this fire sale will be crucial to determining how long the housing market stays in the dumps -- and how quickly blighted neighborhoods can heal. The oversupply is severe: In some major markets, including Las Vegas and San Diego, foreclosure-related sales have accounted for more than 40% of all sales in recent months.


On Monday, new data suggested that pressures like these are starting to drive prices low enough to attract some buyers back into the market. Sales of previously occupied homes jumped 2.9% in February from the month before, the National Association of Realtors said, the first increase since July.


The median price dropped 8.2% from a year earlier to $195,900, the biggest drop recorded by the Realtors in the current slump.


In some beaten-down markets, the price cuts have been stark. The Detroit Board of Realtors recently found that home sales in the city (excluding suburbs) in the first two months of this year jumped 48% from a year earlier, to 1,540. The average home price there sank 54% to about $22,000.


'Got to Move Things'


Banks and others holding foreclosed property have concluded "we've got to move things" and are finally willing to slash prices, says Thomas Lawler, a housing economist in Leesburg, Va.


The supply is piling up fast. Overall, the total number of lender-owned homes doubled last year but sales grew only 4.4%.


This is the first set of positive data we've seen. Don't expect this to be a rapidly improving situation. For the following reasons.


First, note the amount of raw inventory (graphs from Calculated Risk):


This translates into a huge months of supply:


Vacancy rates are at their highest levels
since 1960.


This vacancy rate is already causing huge problems. From Reuters:


Like many cities in the United States where the home vacancy rate has scaled its highest since records began in 1956, the former textile mill city of Worcester in Massachusetts is turning to the courts to fight back.


Their target: banks who abandon properties and who leave behind a glut of empty, dilapidated houses that draw crime, cut tax revenue and depress nearby property values in a market already in a tailspin.


......


The city of 175,898 people, a munitions depot during the U.S. Revolutionary War, offers a window into how U.S. cities are grappling with a wave of foreclosures that has pushed the U.S. homeowner vacancy rate to a record 2.8 percent in the fourth quarter of 2007 -- or about 1 million homes.


Like many U.S. mayors and city officials, O'Brien blames "predatory" lending practices prevalent in the U.S. property boom for the lion's share of about 4,220 mortgages in his city that are either in, or at risk of, foreclosure.


.....


In western New York, the city of Buffalo filed a lawsuit on February 21 against 36 lenders -- including big names like JPMorgan Chase & Co Inc and Countrywide Financial Corp -- who were involved in 57 foreclosures that led to properties being abandoned and ultimately demolished by authorities.


The struggling Rust Belt city, plagued by about 10,000 vacant homes and commercial buildings, estimated the 57 foreclosures cost Buffalo $1 million in demolition work and another $1 million in nuisance costs -- from police patrols to boarding up buildings, to the social toll on communities.


.....


Further east, Syracuse, New York, began selling vacant homes last year for $1 each to non-profit groups who promise to tear them down or renovate them. Last month, Syracuse Mayor Matthew Driscoll extended the deal to private companies.


In other words, the raw amount of supply out there is huge.


Prices still have a long way to go before we're at the end of price drops.


There's an old economic maxim: prices have a way of reverting to the mean (or sometime like that). It simply means there is a historical/average/median price that we can find from simple math. Notice on the above chart we're way outside of that norm.


Finally -- who is going to buy these houses? The US consumer is already in debt up to his eyeballs:


Debt service payments are at all time highs


Household equity is at all time lows.


And high commodity prices are taking their toll as well:


By the end of 2007, 36 percent of consumers' disposable income went to food, energy and medical care, a bigger chunk of income than at any time since records were first kept in 1960, according to Merrill Lynch.


And this is before any discussion about who is going to lend the money to consumers? The financial sector is still reeling from tons of writedowns. And this is before we consider information from the latest Quarterly Banking Survey: