Monday, June 30, 2008

Today's Markets

Chrysler is idling a a minivan plant

The Chicago PMI rose but is still showing a contraction.

MBIA says it's fine. (FYI: so did Bear Stearns)

A morgage ruling could really play havoc with lenders

The S&P 500 fell 8.6% in June


The SPYs opened with a quick move down, but then rallied until just before lunch when they ran into their 200 minute moving average. THey tried to break through, but couldn't. Right after noon CST they fell through all the SMAs, but recovered and tried to rally into the close. But they couldn't maintain momentum and they fell hard in the last 15 minutes of trading.


The QQQQs also opened higher and fell quickly. But notice they couldn't rally to their 200 minute SMA. The QQQQs broke their upward trend a bit after 11 AM CST and then fell until about 1 PM. They tried to rally but again got to within the 200 day SMA and fell. Notice they closed near their low of the day.


The IWMs opened a bit higher and then fell. They rallied to the 200 minute SMA where they traded until noon. Then they dropped, rallied to the 10 and 20 minute SMAs and then fell into the close.

Is A Bear Market Forming?

I am writing this in place of my regular "Market Monday's" column. The reason is we saw a large amount of technical damage to the stock market over the last few weeks and there is growing use of the term "bear market." The question is "Is this title warranted in the current environment?" Let's take a look at the charts and the fundamental background to get an idea. First let's look at the charts.

SPYs or S&P 500

First, I don't look at the Dow Jones Industrial Average. It's 30 stocks whereas the S&P 500 is 500 and represents a far larger swath of the market. In addition, I use the tracking stocks for all the averages.


Let's start with the five year weekly chart. Notice the SPYs traded in un upward sloping channel since the beginning of 2004. They broke through the top trendline at the end of 2006 and bounced off this line at the end of the first quarter of 2007. Then the SPYs went to form a double top in 2007. In early July of last year Bear Stearns announced two of their hedge funds were in serious trouble and the credit crisis started. As a result, the SPYs fell through both of the trend lines of their upward sloping channel. In early 2008 they formed a double bottom, with the second bottom occurring when the Federal Reserve backstopped JP Morgan's purchase of Bear Stearns. Since then the SPYs have been rallying. However, over the last few weeks the SPYs have dropped hard moving through the lower trend line of the upward sloping channel the index originally formed in 2004.


Above is a one year daily chart of the SPYs which I have included to better show the action over the last year. Notice the following:

-- Prices are below the 200 day simple moving average (SMA) -- bear market territory

-- Prices have dropped about 18% from their highs

-- Prices are clearly below the lower trend line of the upward sloping channel the average started in 2004


On the three month chart, notice the following:

-- Prices are below the 200 day SMa

-- All the SMAs are moving lower

-- Prices are below all the SMAs

-- The shorter SMAs are below the longer SMAs

This is the most bearish simple moving average orientation a chart can have.

The NASDAQ 100 or QQQQs


There are two important trends with the QQQQs. The first is an upward sloping channel that started at the beginning of 2004. This trend channel is still intact. The second trend started in mid-2006 and constituted an upward sloping rally from mid-2006 to the beginning of 2008 when the QQQQs fell through this trend line. So, the long-term upward sloping trend remains intact, but the shorter rally is clearly over.


On the one year QQQQ chart, notice three things:

-- The rally that started in mid-March of this year is over, and

-- Prices are below the 200 day SMA

-- Giving the chart a very conservative eyeballing, it's down 16.62% from its late October, early November highs


On the three month chart, notice the following:

-- Prices are below the 200 day SMA

-- Prices are below all the SMAs

-- The 10 and 20 day SMA are headed lower

-- The 10 and 20 day SMA has crossed below the 50 and 200 day SMA

This chart is not entirely bearish year. The longer-term averages (50 and 200 day SMAs) are still bullish. However, with prices and the shorter SMAs below these numbers that won't last for much longer.


On the IWMs 5-year weekly chart, notice the average was in a clear upward sloping channel until late 2007/early 2008 when the average broke through the lower trend line. Since then the average has fallen to the 200 week SMA and has fallen through that important trend line twice. The IWMs formed a double bottom in early 2008 and rallied after the second bottom. The IWMs moved into the 50 week SMA but fell from that SMA and are now through the 200 week SMA again.


On the yearly chart, notice the IWMs were in a clear downward sloping trend from teh end of September to the beginning of March. They index continually moved lower forming consolidation patterns along the way down. This chart also clearly shows the double bottom and the ensuing rally. From the highs of last summer to the current price, the index has dropped about 18%.


On the three month chart, notice the following:

-- Prices broke through the 200 day SMA but couldn't maintain momentum

-- Prices are now below all the SMAs

-- The shorter SMAs are below the longer SMas

-- The 10 and 20 day SMA are both headed lower

-- The 10 day SMA broke through the 50 day SMA and the 20 day SMA is about to cross below the 50 day SMA

In other words, this chart is moving into a very bearish orientation.

So far we have the following:

-- The SPYs and the IWMs are in a very bearish formation

-- The QQQQs are in a neutral bearish formation.

Let's look at the fundamental picture.

The Fed

In their last policy statement, the Fed signaled they are done lowering rates:

The substantial easing of monetary policy to date, combined with ongoing measures to foster market liquidity, should help to promote moderate growth over time. Although downside risks to growth remain, they appear to have diminished somewhat, and the upside risks to inflation and inflation expectations have increased. The Committee will continue to monitor economic and financial developments and will act as needed to promote sustainable economic growth and price stability.


In addition, after adjusting for inflation interest rates are already negative, so there isn't much point in cutting rates further.

Upward Moving Commodity Pricing Pressures


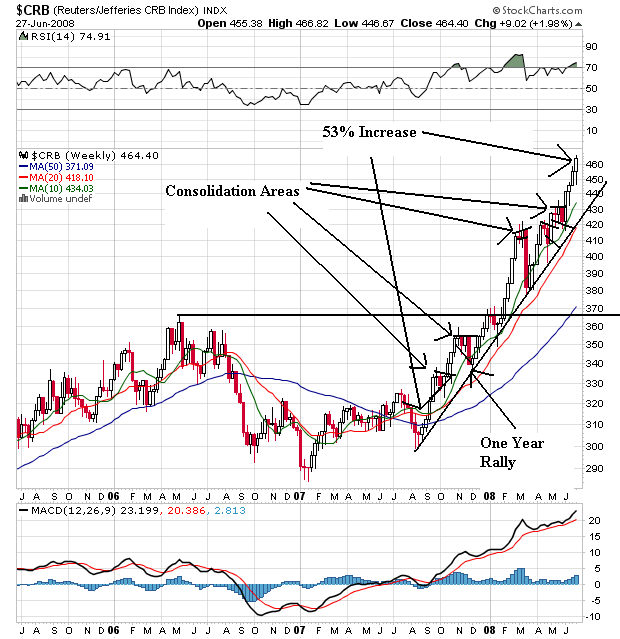
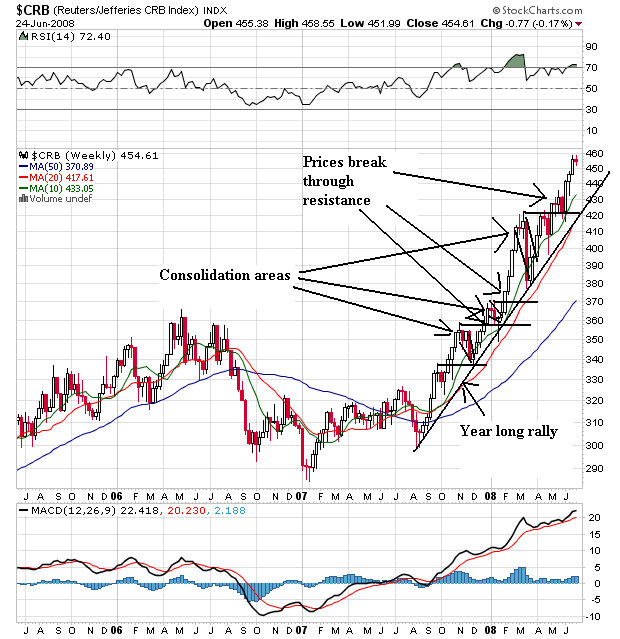
The CRB index is up 53% since August of last year. It is in a clear rally. Notice that as prices have increased they have taken the time to consolidate gains before moving higher. Also notice the following:

-- All the SMAs are moving higher

-- The shorter SMAs are above the longer SMAs

-- Price are above all the SMAs

This is a very bullish chart


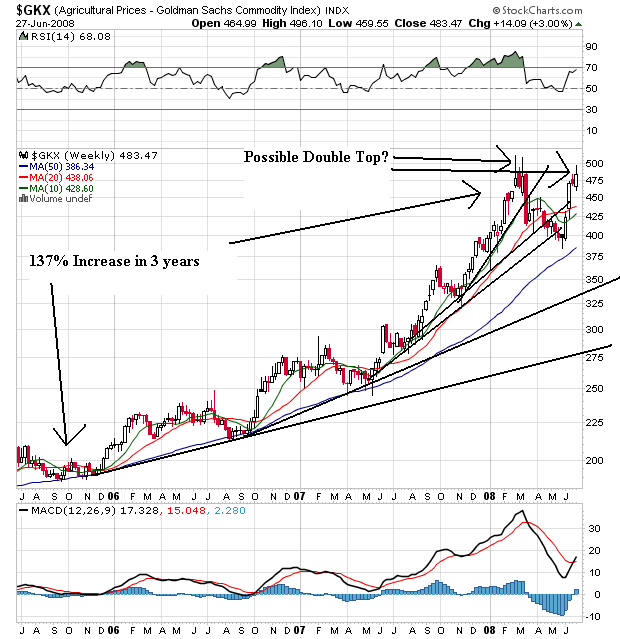
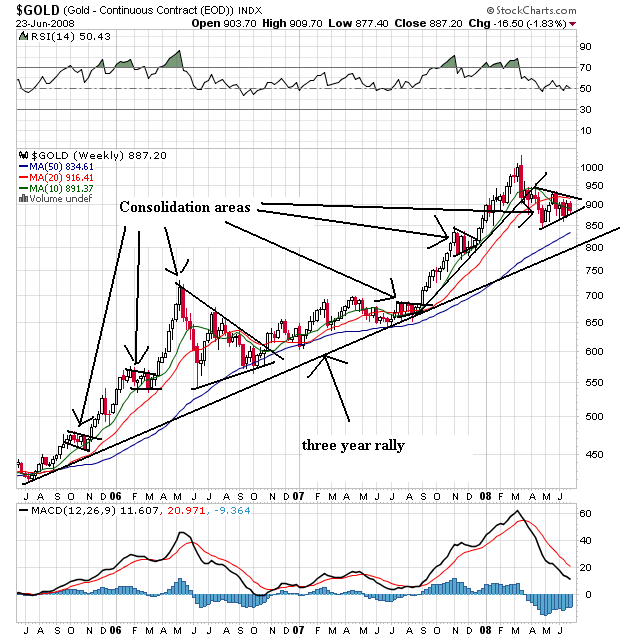
Agricultural prices have been in a three year rally, although they started to correct from this rally earlier this year and broke through key upward sloping support. However, the situation in the US mid-west gave agricultural prices a bid and they have since moved higher. But also note they could be forming a double top here. Also notice the following:

-- Prices are above all the SMAs

-- All the SMAs are moving higher

-- The 10 week SMA moved below the 20 week SMA, altghough the 10 week SMA is still moving higher

This is also a very bullish chart, although we'll have to wait and see how the possible double top plays out.


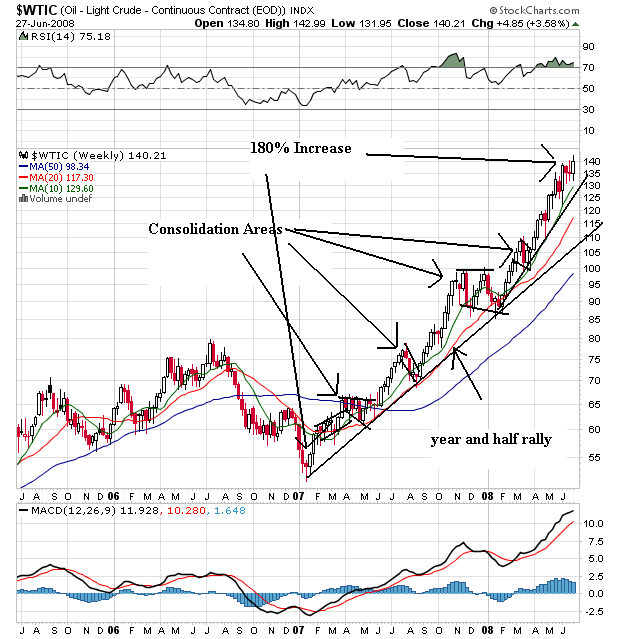
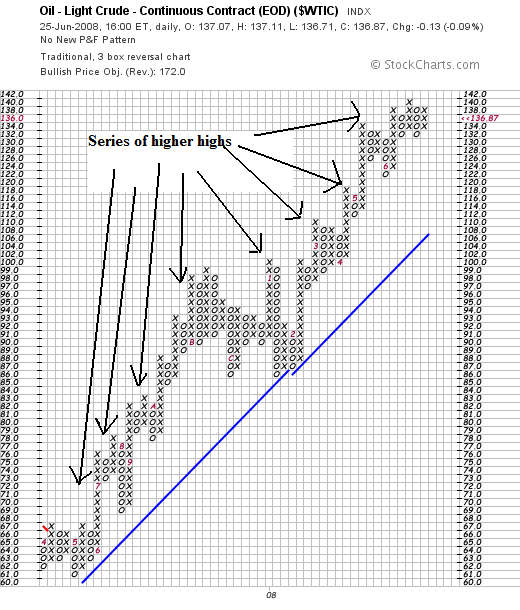
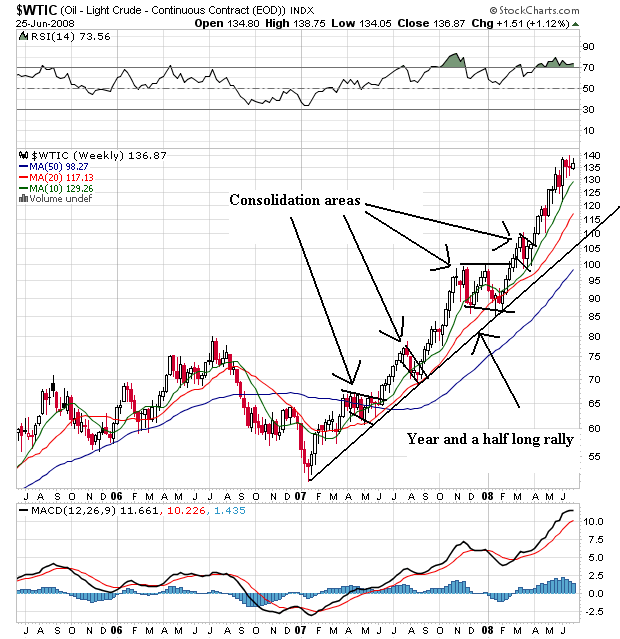
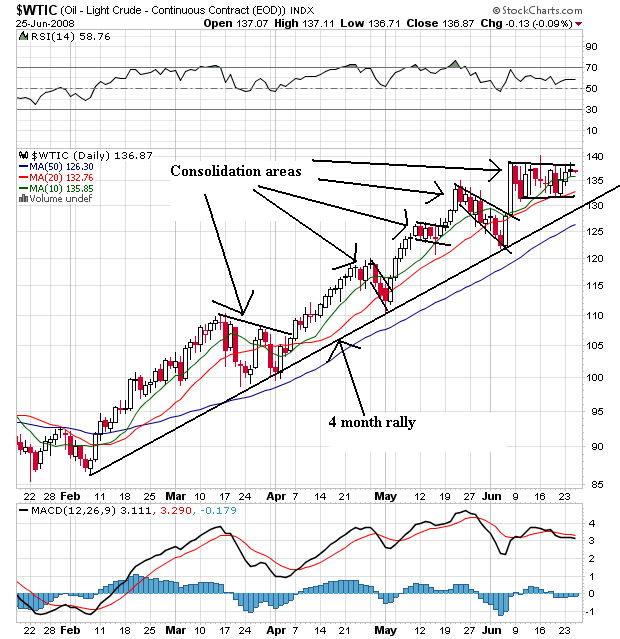
Oil is the 800 pound gorilla in the room. This chart is incredibly bullish. First, notice that for the last year oil has continually moved higher. As it has moved higher it has consolidated gains and then made hew highs. Also notice the following:

-- Prices are above all the SMAs

-- The shorter SMAs are above the longer SMAs

-- All the SMAs are moving higher

This chart is about as bullish as you can get.

So, we have spiking commodity prices hemming in the Fed and consumer spending. In addition, the "stimulus" package is about over; we've got maybe another 2-3 months of mileage from that move. In other words, the possible policy responses from Washington are gone.

A Consumer Under Pressure

Add to all this a deteriorating picture for the consumer. Consider the following charts from econoday:


Job growth is slowing, leading to


Increasing unemployment which is


Lowering consumer confidence and


Consumer sentiment

Let's sum up:

-- Two of the three major averages are in a very bearish orientation while a third is in neutral to bearish territory

-- The Federal Reserve has indicated they are done lowering rates.

-- Higher commodity prices makes further rate cuts highly unlikely and is also hemming in consumer spending

-- The stimulus package from Washington has nearly run its course

-- The job market is weakening which is increasing unemployment and lowering consumer sentiment and confidence.

In other words, there are very few reason to be optimistic right now.

And I will add there are several points I have not gone into:

-- Housing is nowhere near a bottom because of the massive supply/demand imbalance

-- The financial sector is still reeling from writedowns

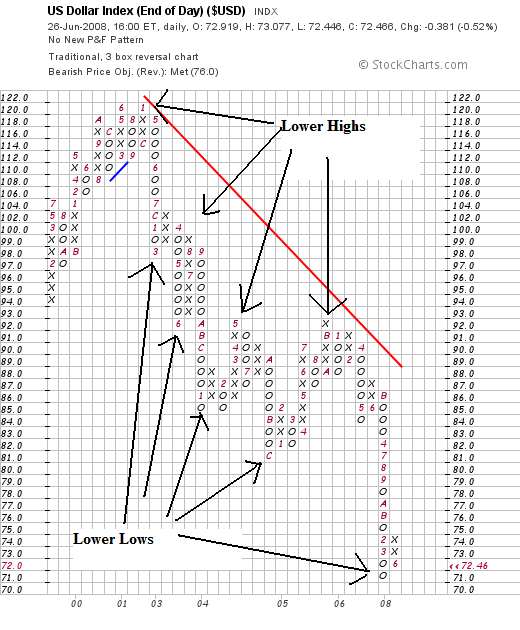
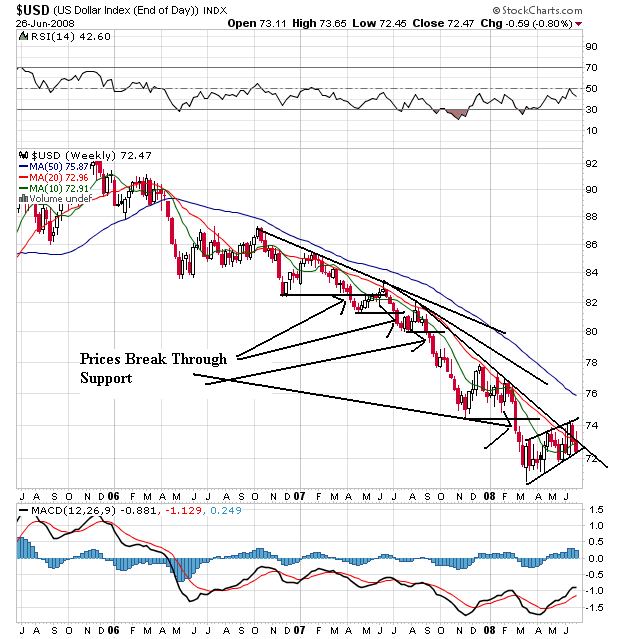
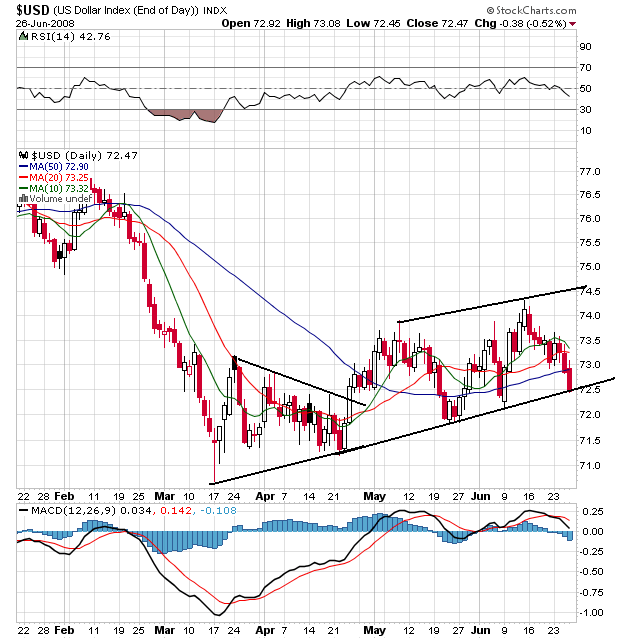
-- The dollar is still dropping

In other words -- there are plenty of negative points I have not made for reasons of brevity, none of which bode well for the future.

Friday, June 27, 2008

Weekend Weimar and Beagle

Well I finally have some pictures of the new kids in the new house.


This is Kate and Scoobey on one of many dog blankets around the house. This is right in front of my desk.


And above is Sarge on his favorite blanket (which he has actually drug around the house). This is right to the left of my desk.

Have a good weekend. I'll be back on Monday.

Forex Fridays -- The Yen

Let's take a look at the weekly and daily yen charts.


On the weekly yen chart, notice the sharp rises and falls over the last year. Also notice the yen continually moved higher, breaking through resistance and consolidating gains in sharply downward sloping pennant patterns. Also note the yen has broken through the trend line it established about a year ago.


On the daily chart, notice the yen has been in a downward sloping pattern for the last three months. While the SMAs have a very bearish orientation with the shortest below the longest, the two shortest SMAs have both moved a bit higher over the last few days.

Forex Fridays -- The Euro

There's been a sea change in the Euro/US relationship which can best be summed up as

The outlook is leading currency traders to temper bets in the euro against the dollar -- not only because euro-zone fundamentals are gnawing away at support for the common currency, but also because a deteriorating forecast will stymie further rate increases there. The Federal Reserve has more room to increase rates after an aggressive easing cycle. The threat of persistent inflation confounding euro-zone policy makers is shared by the U.S. as well.


However, on Wednesday ECD head Trichet reaffirmed his position about a possible rate hike:

European Central Bank President Jean-Claude Trichet repeated Wednesday that the rate-setting ECB governing council could raise the key interest rate July 3, but declined to comment on policy action further down the road to combat runaway inflation.

Mr. Trichet told the European Parliament Committee on Economic and Monetary Affairs in Brussels that the governing council may raise the ECB's main refinancing interest rate "by a small amount" to 4.25% from 4% currently, to anchor inflation expectations. "I said it's possible," he said, adding that markets participants had given this message the necessary attention.


Trichet has been consistently hawkish regarding interest rate policy.

Let's go to the charts:


On the weekly chart, notice the euro has been in a consistently rising position. It has moved through areas of resistance, consolidated gains and then moved higher. Also note the very bullish SMA alignment. The 20 and 50 week SMAs are both moving higher. While the 10 week line is currently moving sideways the remainder of the indicators tell us the chart is still in a rally mode. If the 10 week moves through the 20 in a convincing manner, then we'll get concerned.


On the daily chart, notice we're still in a consolidation pattern with prices and the SMAs giving a ton of contradictory signals.

Incomes With And Without Free Money

From Marketwatch:

Excluding the impact of the rebates and inflation, real disposable incomes were flat.


In other words, absent a one time stimulus from the Federal government, everything is not OK. That does not mean the checks aren't important because they did add to income for a certain period of time. But it's incredibly important to remember a one time event that is impacting the raw numbers. Over the next few months we'll see a return to non-stimulus numbers. And those probably won't be that good. Why you ask? How can someone get a raise when the job market is deteriorating?


Year over year job growth has been deteriorating for a long time, and


Unemployment is increasing.

This is not an environment where an employee can say, "I need a raise."

Forex Fridays -- The Dollar

I'm going to start to break the forex segment down into three pieces, one on each of the the big currencies. Today we'll start with the dollar because the Fed met this week and left rates unchanged. Here is the key phrase from their policy statement:

The Committee expects inflation to moderate later this year and next year. However, in light of the continued increases in the prices of energy and some other commodities and the elevated state of some indicators of inflation expectations, uncertainty about the inflation outlook remains high.


Markets took this as the Fed nothing up their inflation fighting rhetoric. In essence, the Fed was saying "we're pretty much done lowering rates; our next move will be higher. We're not doing that today, but we're closer to doing that now than yesterday."

Let's take a look at the charts:


Let's start with the P&F chart, which is a great way to cut out the market noise and see what prices are really doing. With the P&F chart, notice the dollar has been dropping since 2001. Combine that with the fact the US experienced an expansion starting at the end of 2001 and you get an idea for how deep the problems with the dollar go.


On the weekly chart, notice the following:

-- Prices have been dropping for the better part of two years, continually moving through support levels to establish new lows

-- Prices have been using the 10 and 20 week SMA as resistance areas

-- The 20 and 50 week SMA are currently moving lower

-- The 10 week SMA is moving up and is about to cross over the 20 week SMA. This is a positive development. However...


The dollar is at the bottom of a consolidation range with the momentum indicators giving an overbought signal. The SMAs are giving a counter-veiling signal. All three are generally moving up. However, I think this week's fundamental events (the Fed leaving rates unchanged) adds downward pressure.

Thursday, June 26, 2008

Today's Markets

The markets had a terrible day. First, let's look at some observations from Briefing.com regarding the market.

This is from their noon update:

The financial sector has come under heavy pressure, currently down 2.9%, after Goldman Sachs lowered its rating on the broker sector and indicated Citigroup (C 17.78, -1.07) may incur additional write-downs and may also raise more capital, according to reports. Reports also indicated Goldman believes Merrill Lynch (MER 33.94, -1.52) may also raise capital. Shares of C were added to Goldman’s Conviction Sell List, according to Dow Jones.


Once again we see financials are a big reason for the problems. As I posed below this shouldn't be a surprise. We are still hearing reports from the financial sector that they need to raise more cash, writedown more assets, cut more dividends and sell more assets.

And then there was oil:

Crude oil jumped above $140 a barrel to a record as Libya threatened to cut output, OPEC's president said prices may reach $170 by the summer and the dollar weakened.

Libya may curb output because of a U.S. law that allows terror victims to seize assets of foreign governments as compensation. OPEC President Chakib Khelil said oil may surge on a European interest rate rise, France 24 reported. Oil, gold and copper climbed today as the dollar dropped because the Federal Reserve gave no signal of higher interest rates yesterday.


At a time when infltion worries are picking up we now have another day when oil hits a record. This is not what the market needed.

GM was downgraded:

Goldman also lowered its opinion of General Motors (GM - Cramer's Take - Stockpickr). Losing 10%, GM, along with fellow Dow component Citi, led the index downward. Every Dow stock was losing ground.


All in all, it was a terrible, horrible, no good very bad day. Let's go to the charts.


Above are the weekly charts for all the indexes. Simply notice that today's action was a clear reversal of direction in a bid way.


The SPYs opened lower and continued to move down for the rest of the day. This is clearly a very bearish chart that does not bode well for the future.


As with the SPYs, notice the clear downward trend of the QQQQs. The index could not find bottom all day and closed near its session lows.


Interestingly enough, the IWMs didn't close at session lows, but still had a terrible day.

The bottom line is today the market realized there were still problems in the economy. The financial sector is still in trouble and the overall economy is lukewarm at best.

Markets Are Getting Killed

As of this writing, everything is down over 2% for the day. I'll have the charts and news when the market closes.

The Credit Crisis is Far From Over

From Bloomberg:

Fortis, Belgium's biggest financial- services company, scrapped a 1.3 billion-euro ($2 billion) cash dividend and will sell shares and assets to shore up capital as the earnings outlook deteriorates.

Fortis slumped as much as 12 percent to the lowest in five years after the company said today in a statement it will raise 8 billion euros by selling stock and ``non-core'' assets such as real estate. It is eliminating the interim dividend for the first time in at least three years.

Chief Executive Officer Jean-Paul Votron said he needs to take ``exceptional measures'' because the business environment won't improve anytime soon. Fortis is reeling after it spent 24 billion euros to buy part of Amsterdam-based ABN Amro Holding NV in the biggest banking takeover in history, just as the subprime mortgage market collapsed.


From Bloomberg:

Citigroup Inc., the bank that's posted the biggest losses from the collapse of the U.S. mortgage market, may take an additional $8.9 billion in net writedowns in the second quarter, Goldman Sachs Group Inc. said.

Goldman also lowered its rating on U.S. brokerages to ``neutral'' from ``attractive,'' saying the pace of deterioration in the industry ``appears to be far worse than'' it originally anticipated, according to a June 25 note.

``The turnaround in business trends that we had been expecting in the second half of 2008 may not occur as quickly as we should have thought,'' Goldman said. ``We see multiple headwinds for Citigroup,'' such as risks of further writedowns, higher consumer provisions, and the potential need for additional capital raisings, dividend cuts or asset sales, Goldman said.


From the BBC:

Barclays has said it is planning to raise £4.5bn ($8.8bn) in a share issue to bolster its balance sheet.

The firm is to sell shares to new investors, such as the Qatar Investment Authority, and existing shareholders including China Development Bank.

Barclays said the fundraising move would "strengthen its capital base".

It is the latest British bank, following the Royal Bank of Scotland and HBOS, to seek to raise money to ease the impact of the credit crunch.


And then there is this:

Goldman Sachs cut its rating on U.S. brokers to neutral from attractive, and put Citi on its conviction sell list, saying that while it still believes the market is putting too much weight on the possibility that another investment bank may fail, it is "hard pressed" to find a catalyst to move the group significantly higher over the next few months as fundamentals continue to deteriorate.


This is simply over the last two days. Add this so last week's news -- Citigroup announcing more writedowns and a Goldman Sachs report that regional banks will need an addition $65 billion -- and you get a very dour picture of the financials indeed.

Thursday Oil Market Round-up

Let's start with the P&F chart, because it shows a very important point:


Despite all the talk about trying to boost production etc., prices have only gone higher. Oil has an incredibly strong series of increasing highs. This is a really bullish chart.


On the weekly chart, notice the following:

-- Prices have been in a rally for the last year and a half

-- Prices have moved through resistance levels and then consolidated their gains

-- All the SMAs are moving higher

-- The shorter SMAs are above the longer SMAs

-- Prices are above all the SMAs

This is still a very bullish chart.


On the daily chart, notice the following:

-- Prices have been rallying for 4 months

-- Prices are above all the SMAs

-- All the SMAs are moving higher

-- The shorter SMAs are above the longer SMAs

This is also a very bullish chart

Wednesday, June 25, 2008

Today's Markets

-- California and Illinois are suing Countrywide Financial

-- Bank of American's purchase of Countrywide may pay for itself in tax savings

-- Barclay's Financial is getting $8.8 billion in fresh capital.

-- New Homes sales continue to drop


Notice the following on the SPYs daily chart:

-- Prices are back where they were when the Fed backed the Bear Stearns deal.

-- Prices are below all the SMAs

-- All the SMAs are headed lower

-- The shorter SMAs are below the longer SMAs

-- Prices are below the 200 day SMA


On the QQQQs daily chart, notice the following:

-- Prices are below the 200 day SMA

-- The 10 and 20 day SMA are heading lower

-- The 10 day SMA has crossed through the 200 day SMA

-- Prices are below all the SMAs


On the IWMs, notice the following:

-- Prices are below the 200 day SMA

-- The 10 and 20 day SMA are both headed lower

-- Prices are below all the SMAs

-- The 200 day SMA is headed lower -- and never turned positive.

None of these charts is very bullish. The SPYs chart is turning more and more bearish.

The Fed's Statement

From the Fed's website:

Recent information indicates that overall economic activity continues to expand, partly reflecting some firming in household spending. However, labor markets have softened further and financial markets remain under considerable stress. Tight credit conditions, the ongoing housing contraction, and the rise in energy prices are likely to weigh on economic growth over the next few quarters.


Translation: The economy grew .9% in the first quarter. It's something. But it's harder to find a job, it's harder to get a loan, housing still sucks and it's really expensive at the pump. These are most definitely not good things and they will make it hard to make money going forward.

The Committee expects inflation to moderate later this year and next year. However, in light of the continued increases in the prices of energy and some other commodities and the elevated state of some indicators of inflation expectations, uncertainty about the inflation outlook remains high.


If we cross our fingers and think good thoughts, inflation will come down (We'll ignore the fact that UPS and FedEx have warned on earnings because of high prices and that Dow Chemical raised prices 25% because of inflationary pressure). But eneregy prices are really stubborn right now, so we'll keep thinking good thoughts and hope the inflation comes down.

The substantial easing of monetary policy to date, combined with ongoing measures to foster market liquidity, should help to promote moderate growth over time. Although downside risks to growth remain, they appear to have diminished somewhat, and the upside risks to inflation and inflation expectations have increased. The Committee will continue to monitor economic and financial developments and will act as needed to promote sustainable economic growth and price stability.


We've already thrown a ton of money at the problem, so stop complaining. Because we've put a ton of money out on the street like a cheap hoar we don't expect things to get really bad. But man, energy is really expensive and it could be a problem down the line. In fact, people are actually noticing the energy prices are increasing

That's about the gist of it.

Waitin' On the Fed

Today is Fed day. That means we're all waiting -- Waitin' On the Fed. In tribute to this event, here is a ZZ Top video of "Waitin' On the Bus". Just substitute "Fed" for Bus while you, um wait for the Fed.

Durable Goods Orders Fair

From Dow jones

Demand for expensive goods were flat in May, and a barometer of capital spending by businesses retreated, government data on the economy Wednesday showed.

Orders for durable goods didn't change last month, holding at a seasonally adjusted $213.64 billion, the Commerce Department said. Durables, which are manufactured goods designed to last at least three years, decreased 1.0% in April, revised down from a previously estimated 0.6% decrease.

While the data showed orders going nowhere in May, the report was better than Wall Street expected; economists had forecast a drop of 0.5%.

But durable orders have gone up measurably only twice over the past six months, a sign of what the sluggish economy is doing to the manufacturing sector.

A barometer of business equipment spending - orders for non-defense capital goods excluding aircraft - decreased in May by 0.8%, after rising 3.1% in April.


The above chart makes the data a bit easier to understand. First notice the gray lines which represent the month over month change. Notice the lack of overall movement. We've seen a ton of small moves. There was also a big move about 6 months ago, but that was countered by the next months downward move.

Note especially the year over year number. First -- notice the scale on the right. The year over year change has been fluctuating a bit above 0% for the last 9-12 months. Also note the year over year number is in a clear downtrend. The bottom line is this number is slowing.

Wednesday's Commodities Roundup

Today I'm going to look at two indexes: the CRB and gold. The CRB represents all commodities (although it is more skewed towards energy) and gold represents inflation expectations.


The weekly CRB chart shows a very strong rally that started about a year ago. Note that prices have continually moved higher, broken through resistance and consolidated gains. Regrading the SMA, notice the following:

-- All the SMAs are moving higher

-- The shorter SMAs are above the longer SMAs

-- Prices are above all the SMAs

This is a bullish chart, plain and simple.


On the P&F chart, notice that prices have continually made higher highs.


On the daily chart, notice that prices had a hard time getting through the 120 - 130 area, but have now broken out of this level. On the SMA front, notice the following:

-- All the SMAs are moving higher

-- Prices are above the SMAs

-- The shorter SMAs are above the longer SMAs

This is a bullish chart.


Gold is in the middle of a multi-year rally. It has continually moved higher, breaking through resistance and consolidating gains.


However, the P&F chart shows gold is in the middle of a correction from its rally with ha series of lower highs.


Gold's daily chart shows prices are currently in the middle of consolidating. Also note that prices and the SMAs are bunched together indicating a clear lack of direction.

Tuesday, June 24, 2008

Today's Markets

-- Oil closed at $137/bbl

-- US Home prices dropped 15% year over year.

-- Consumer confidence dropped

-- Corporate profits are seen dropping 10%

-- Circuit City is up for sale.

-- Dow Chemicals raised prices 25% due to energy costs


The SPYs dropped on the open, and the rebounded by 10:39 CST. Then they rallied, broke through the 200 minute SMA but couldn't hold the momentum. THey formed a double top and then fell into the close, ending up nearly where they opened the session.


The QQQQs opened by moving lower but quickly rallied into their 50 minute SMA. They moved sideways until a bit before 1 PM CST when they tried to move through the 200 minute SMA. But they couldn't maintain momentum and gell into the close.


The IWMs opened with a move to the downside where they formed a double bottom. They rose through the 50 minute SMA, but then trended down for the rest of the day.