Home prices in 20 U.S. metropolitan areas fell in April by the most on record, signaling the housing recession is far from over, a private survey showed today.
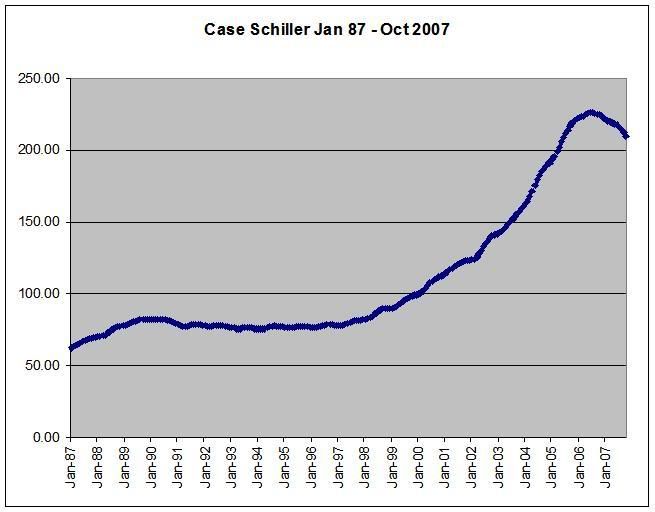
The S&P/Case-Shiller home-price index dropped 15.3 percent from a year earlier, less than forecast, after a 14.3 percent decline in March. The gauge has fallen every month since January 2007. The group began keeping year-over-year records in 2001.
Mortgage defaults and foreclosures are adding to the glut of properties on the market, while stricter loan rules are making it more difficult for prospective buyers to get financing. The prolonged real-estate slump, along with higher fuel prices and a shrinking job market, is taking a toll on consumers and the economy.
``There's such an excess of inventories that we certainly expect to see more price declines,'' said James O'Sullivan, a senior economist at UBS Securities LLC in Stamford, Connecticut. ``The economy is still weakening and housing still looks pretty weak.''
.....
All of the 20 cities in the index showed a year-over-year decrease in prices for April, led by a 27 percent drop in both Las Vegas and Miami. Charlotte, North Carolina, showed a decline for the first time.
One bright spot in the report was that more cities showed a gain in prices in April compared with the previous month. Houses in eight areas rose in value, compared with just two in March. Month-over-month gains were led by Cleveland and Dallas.
``There might be some regional pockets of improvement, but on an annual basis the overall numbers continue to decline,'' David Blitzer, chairman of the index committee at S&P, said in a statement.
This index has been dropping for a year and a half. That's called a trend. And it's not a good trend.
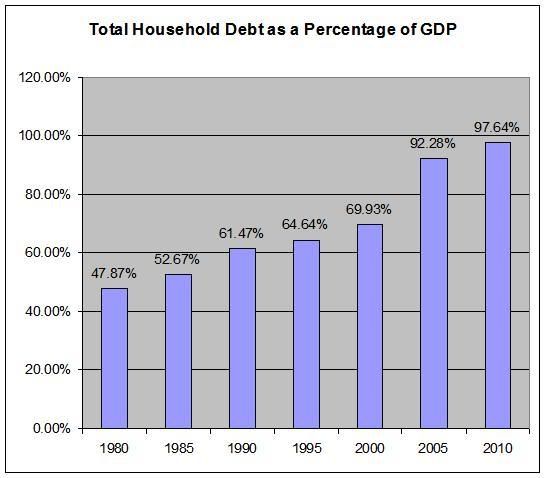
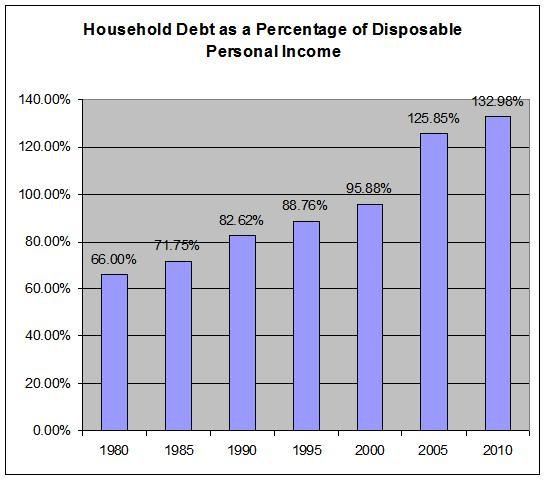
In addition, this isn't going to end anytime soon. Inventory is still sky high and consumer demand is still hampered by massive debt and low confidence.
Speaking of which...
Confidence among Americans dropped to the lowest level in 16 years and house prices fell the most on record, raising the risk that consumers will cut back on purchases after spending their tax rebates.
The Conference Board's confidence index fell to 50.4 in June, lower than forecast, from 57.2 in May. Home prices in 20 cities dropped 15.3 percent in April from a year earlier, according to S&P/Case-Shiller, the most since the group began collecting data.
Consumers, whose spending accounts for more than two thirds of gross domestic product, are being hurt by the housing slump, rising unemployment and higher food and fuel bills.
Short version: this is bad news all the way around. Period.